
Let Databricks do what Databricks does best. Move batch and streaming tasks to Haevek's Falcon Compute Platform to save on the base load.
Your team has tried everything on the Databricks cost checklist. Auto-termination is running. Cluster policies are tuned. Batch jobs have been moved to Jobs Compute. You've evaluated Photon, reviewed query plans, and tightened idle cluster timeouts. And yet, at the end of every quarter, finance is still asking why the bill hasn't moved.
You can't right-size your way to 80% savings when the engine itself is the source of overprovisioning.
The reason those optimizations haven't worked is that they're targeting the wrong part of the spend.
The Limits of Standard Databricks Cost Advice
Roughly 70–80% of a typical enterprise Databricks bill is production compute: batch ETL pipelines running nightly or hourly, and streaming ingestion jobs that run 24 hours a day, seven days a week. The remaining 20–30% is interactive work: analysts running ad-hoc queries, data scientists iterating in notebooks, exploratory SQL against Delta tables.
It used to be that running these costly streaming and batch processes on Databricks or Spark was the only path forward, despite its old scaling and resource approaches. To optimize, we tried to chip away at the small slice that is interactive work.
To understand why those production jobs are so expensive, you need to understand what Spark and the JVM are doing underneath Databricks.
The heart of the Databricks platform is Apache Spark, which uses the Java Virtual Machine as its execution runtime. The JVM interprets Java bytecode, meaning every operation passes through an abstraction layer rather than compiling directly to machine instructions. When a job processes a terabyte of data, it constantly serializes records into JVM objects, ships those objects between workers across the network, and deserializes them on the other side. Between each of those steps, the garbage collector periodically pauses every thread while the JVM reclaims memory, adding latency that compounds across a large cluster.
To meet SLAs, it is necessary to provision a lot more compute capacity to account for garbage collection and the JVM abstraction layer — often 5–10x the footprint they theoretically require. If a pipeline needs 40 cores to process a daily ingestion volume within a given window, that same pipeline running on Spark typically requires 200–400 cores to reliably hit that window, because GC pauses, serialization overhead, and spike buffers all eat into the headroom.
If a pipeline needs 40 cores to process a daily ingestion volume within a given window, that same pipeline running on Spark typically requires 200–400 cores to reliably hit that window.
Standard FinOps advice optimizes around the edges. You can switch to spot instances and you cut the per-hour rate, but you are still running 400 cores. Photon speeds certain analytical queries through vectorized execution outside the JVM (at a substantial cost premium), but any deviation from a Photon-supported function brings the JVM, GC overhead, and serialization costs back into play.
Regardless of whether you are running a managed service (e.g., Databricks, Amazon EMR, Azure HDInsight, Google Dataproc) or self-managed Spark, the underlying cloud compute bill still stays the same. What varies is what you pay on top of that: Databricks and equivalents add a licensing layer, while self-managed Spark trades that licensing cost for the engineering hours needed to maintain and tune the cluster yourself. Managed services exist largely because that operational and integration burden is real and significant. Yet none of these choices reduce the compute footprint itself, because the JVM inefficiencies and subsequent overprovisioning problem runs underneath all of them. You're still provisioning 5–10x more compute than you theoretically need, regardless of how you manage it.
The only lever that changes the core-hours-per-unit-of-work ratio is replacing the compute engine itself.
Why a 93% Infrastructure Reduction Is Architecturally Achievable
Haevek's Falcon Compute Platform can take on those loads with less compute. It does not need the over provisioning as it is compiled into a native binary and does not require garbage collection.
Falcon is a distributed compute engine built in Rust as a complete ground-up redesign of Apache Spark. Every data processing step compiles to machine instructions that execute directly on the CPU with optimal offloading to specialized chips (GPUs, TPUs, etc.) when workloads require it. Falcon's pipeline model keeps data in contiguous memory structures rather than converting records to Java objects, so there's no memory overhead or serialization penalty between processing stages. The throughput-per-core is structurally different from anything running on the JVM.
Benchmark · Commercial data analytics company
432 cores on Databricks. 32 cores on Falcon. A 93% reduction in compute infrastructure.
A production real-time streaming ETL workload was processing multi-terabytes per day on Databricks using 432 cores for a single pipeline. The same pipeline, running the same transforms on the same data, required 32 cores on Falcon. Annual spend dropped from $464K to $66K for this job, an 85% reduction in total cost of ownership (TCO).
The 93% figure reflects the compute footprint change. The 85% TCO figure is the net comparison including infrastructure and software license costs for Falcon and Databricks.
Falcon also eliminates the always-on cluster problem through Kubernetes-native execution. Each pipeline runs as an atomic K8s job: compute activates when the job starts and releases when it finishes. For streaming workloads, Falcon bursts to meet throughput demand and scales back immediately, without maintaining a warm cluster between micro-batches. A Databricks streaming cluster bills continuously whether it's processing 100,000 events per second or 10.
You don't have to migrate data or re-architect; Falcon reads from and writes to the same lakehouse as Databricks. The new solution works with your existing object store's Delta Lake and Iceberg tables. Unity Catalog remains the governance layer, with no data migration, no catalog re-registration, and no changes to access policies or table contracts. Falcon is a pure compute engine and knows how to stay in its lane.
.png?width=2525&height=2121&name=Haevek-Falcon-Infographic%20(1).png)
Falcon deploys on any Kubernetes environment such as EKS, AKS, GKE, OpenShift, or whichever is already running in your cloud account. Falcon supports direct bindings to existing libraries across languages, so teams can call Python, C/C++, or other dependencies natively within a single job without a separate service layer. For example, ONNX (Open Neural Network Exchange, an open standard format for packaging and sharing machine learning models) models can be embedded directly in the pipeline, eliminating the separate model-serving infrastructure many teams run alongside Databricks for batch inference.
Prioritizing Workloads to Reduce Costs on the 80%
Building Your Offload Shortlist
Right now, you can identify candidates for migration to Falcon. Before you change anything, you need to know exactly which jobs are costing you the most. Databricks System Tables make this straightforward.
Step 1. Run the following query against system.billing.usage filtered to a 30-day window:
-- Run this in your Databricks SQL workspace.
-- Ensure you have the appropriate permissions to query system tables
-- and that Unity Catalog is enabled in your workspace.

-- First, set the system catalog:
USE CATALOG system;

-- Verify your exact billing_origin_product values by running:
-- SELECT DISTINCT billing_origin_product FROM billing.usage LIMIT 100

SELECT
  COALESCE(usage_metadata.job_name, usage_metadata.job_run_id) AS job_identifier,
  billing_origin_product,
  sku_name,
  SUM(usage_quantity) AS total_dbus,
  COUNT(DISTINCT usage_metadata.job_run_id) AS run_count
FROM billing.usage
WHERE usage_date >= CURRENT_DATE() - INTERVAL 30 DAYS
  AND billing_origin_product IN ('JOBS', 'STREAMING', 'MODEL_SERVING')
GROUP BY
  COALESCE(usage_metadata.job_name, usage_metadata.job_run_id),
  billing_origin_product,
  sku_name
ORDER BY total_dbus DESC
LIMIT 20;
Step 2. Sort by total_dbus descending. The top results are your offload candidates. Flag anything running more than four hours per execution or anything with a run_count close to 720 for the month: that's a job running every hour, which means it's always on.
Step 3. Categorize items. Three categories are typically worth targeting:
- Long-running batch ETL: Nightly or hourly transforms over large datasets, such as multi-terabyte ingestion, enrichment, and aggregation pipelines. These typically run on Jobs Compute and carry the JVM overhead multiplier across every execution.
- 24/7 streaming ingestion pipelines: Always-on clusters that never scale to zero. A streaming cluster maintained for continuous processing bills continuously, even when throughput is low. That idle overhead is structural and can't be tuned away.
- High-throughput analytics and AI/ML inference jobs: Scheduled batch analytics, ML inference, data enrichment, or embedding generation pipelines. Think "what we run to make enriched gold data from silver data" in a medallion architecture. Spark was designed for table transforms, not matrix operations, which means these workloads tend to overprovision even more severely than standard ETL on the JVM.
Some workloads belong on Databricks and should stay there: interactive SQL exploration, notebook-based ML experimentation, Delta Live Tables pipelines tightly coupled to Databricks orchestration, and anything where analyst iteration speed matters more than infrastructure efficiency. The goal is to shift the 70–80% of spend running on production compute off the JVM runtime and keep Databricks where it earns its place.
The Test Flight: How the Side-by-Side Benchmark Actually Works
Will Falcon work on these workloads? What kind of savings can you get? The Falcon Test Flight is designed to answer these questions without interfering with your operations or creating new costs.
Haevek engineers help you deploy Falcon into your cloud environment using narrowly scoped permissions: no access to your Databricks workspace, your governance layer, or any data plane beyond the specific object store paths needed for the benchmark workloads. You select up to three production-representative jobs — typically one batch ETL pipeline, one streaming ingestion job, and one inference workload if applicable — and run the same jobs in parallel with the same source data in both Falcon and Databricks, writing to separate output paths. The measurement framework covers four dimensions:
- Wall-clock runtime: end-to-end job duration, not just execution time
- Compute cores consumed: averaged across multiple runs, not a single sample
- Infrastructure cost at list pricing: so the comparison is apples-to-apples regardless of your negotiated rates
- Output correctness: schema parity, row counts, and any business-logic assertions your existing test suite covers
The parallel-run phase is instrumented via Prometheus and Grafana, giving you side-by-side utilization metrics: raw infrastructure telemetry from your own environment, not a vendor-provided summary.
The typical engagement runs two to eight weeks depending on your organization's complexity, with about two weeks of engineering time. You get empirical data quickly that incorporates Falcon's performance, license cost, infrastructure, maintenance, and support requirements so you can make a data-informed decision on what's right for you. If the numbers don't clear your bar, there's no commercial conversation to have.
The commercial data analytics customer described above achieved 93% less compute infrastructure and 85% TCO reduction on a multi-terabyte-per-day real-time streaming ETL workload. A second benchmark, covering multi-terabyte daily batch and stream processing replacing production Databricks jobs across two pipelines, produced an 80% faster runtime, 94% lower cloud cost, and 63% lower TCO versus Databricks, implemented in 7 days. The first production customer recovered their full annual license cost from TCO savings within 73 days of cutover.
Once the benchmark clears your bar, cutting a live pipeline over without downtime is its own sequence. We've broken that out into The Databricks Offload Playbook.
Reading the Numbers: What Falcon Does to Your Annual Bill
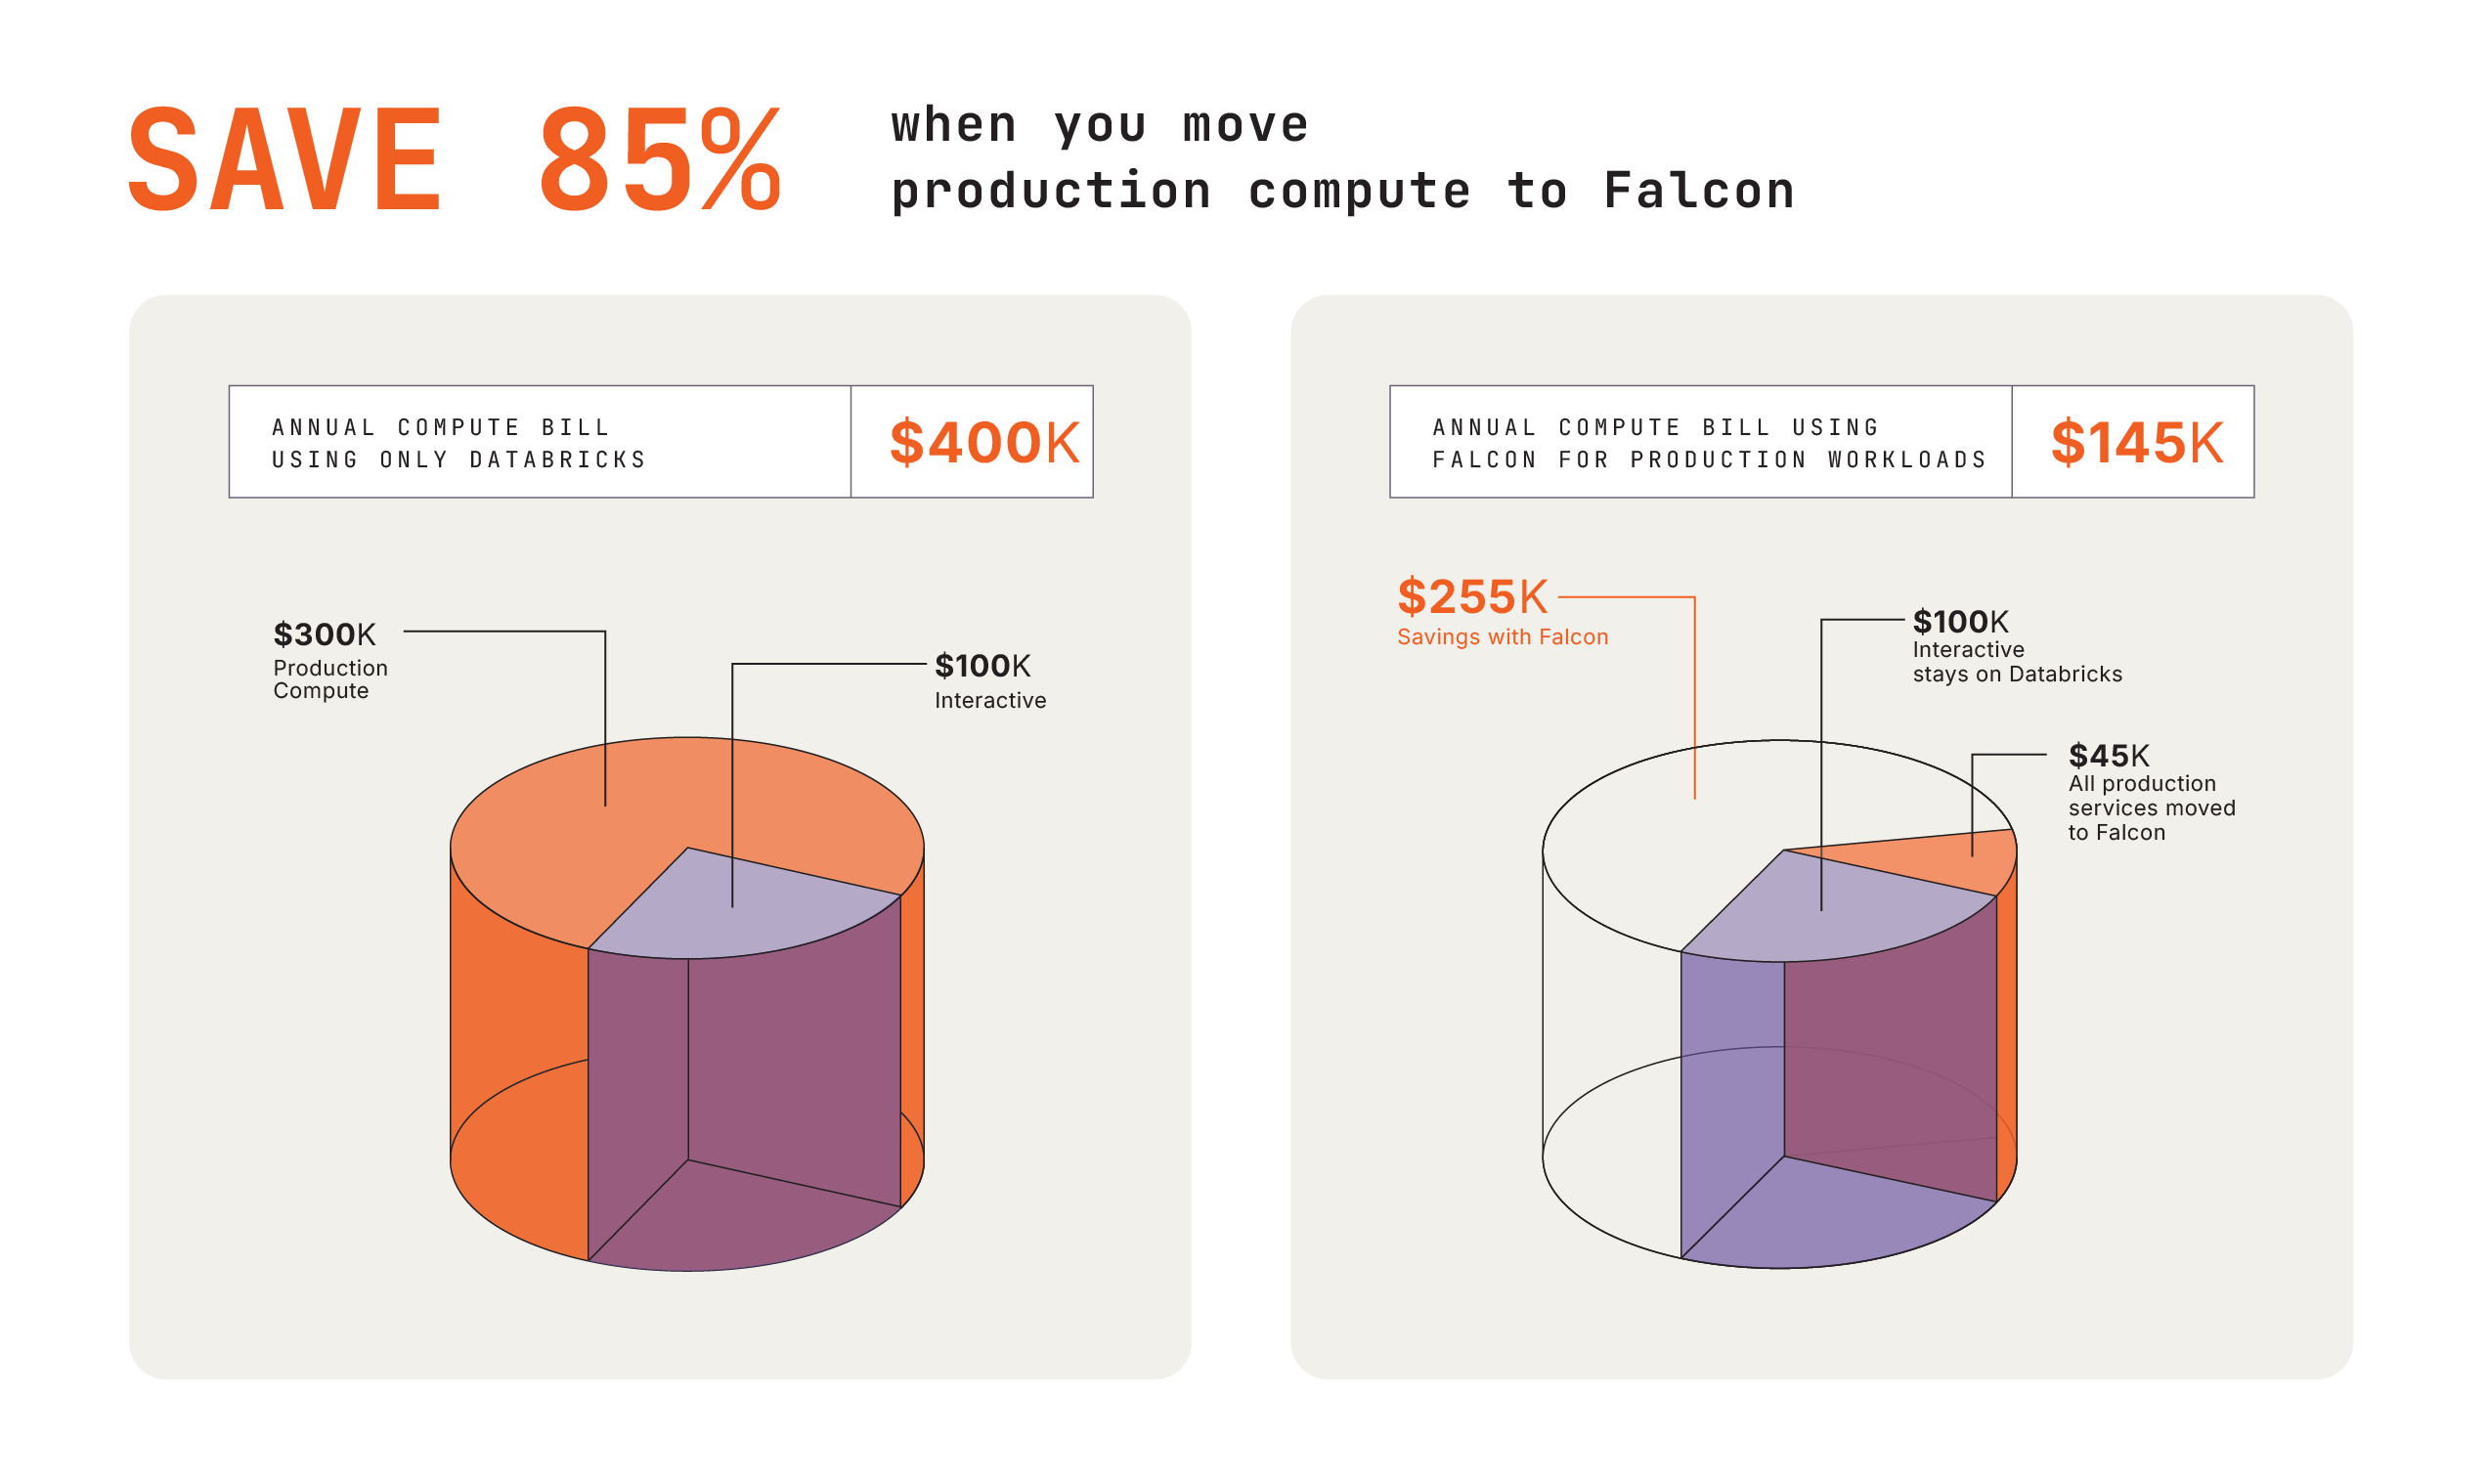 Consider a representative mid-market account with a $400K annual Databricks bill. If 75% of that spend is production compute — batch ETL, streaming pipelines, scheduled inference — that is $300K running on the JVM that can be migrated. Based on the 85% TCO reduction from the commercial streaming benchmark (which accounts for Falcon's license cost), 85% of $300K translates to roughly $255K in annualized savings. The remaining $100K covering interactive exploration stays on Databricks and is untouched.
Teams running 5–10x excess capacity see the largest absolute savings because the efficiency gain applies to the biggest base. Falcon's licensing is priced by parallel cores and throughput tiers, which means the cost model scales down with the infrastructure footprint. You are not paying for capacity you are no longer consuming.
Those savings right now are compelling, but it also sets an organization on a powerful path for the future. The expectation that enterprises will utilize their data for more AI inference will mean more utilization of Falcon instead of Databricks, where the overprovisioning problem would compound. Spark wasn't built for matrix operations at scale, and JVM GC behavior is especially punishing for memory-intensive workloads. Falcon handles batch ETL, streaming, and ONNX inference in a single pipeline, eliminating the separate model-serving infrastructure that many teams run alongside Databricks as inference volumes increase. Each new inference pipeline that spins up on the JVM is another candidate for the shortlist.
A Next Step
If you are an operator for your Databricks instance, you can find out in five minutes what the potential is for savings. Open a Databricks SQL notebook and run the system.billing.usage query from the Prioritizing Workloads section above. Filter to the past 30 days, scope to JOB and STREAMING SKUs, and sort descending by total DBUs. Pull the top three results: job name, SKU, and total DBU consumption.
That list is your Test Flight candidate set.
The Falcon Test Flight runs up to three of your production workloads side-by-side against your live Databricks jobs, in your environment, on your actual data, using your infrastructure metrics. Success criteria are defined upfront and tailored to your specific workloads. Within weeks, you'll have empirical numbers you generated yourself, not a vendor benchmark, that tell you exactly what Falcon would do for your stack.
Get started
Contact Haevek to learn more or sign up for a test flight.
Keep reading
The Databricks Offload Playbook: Four Steps to Cut Over Without Downtime
The operational sequence for moving a live pipeline off Databricks compute without an outage.
Replacing Databricks Compute with Falcon: Frequently Asked Questions
Unity Catalog, Photon, Kubernetes support, benchmark access scope, and what stays on Databricks.